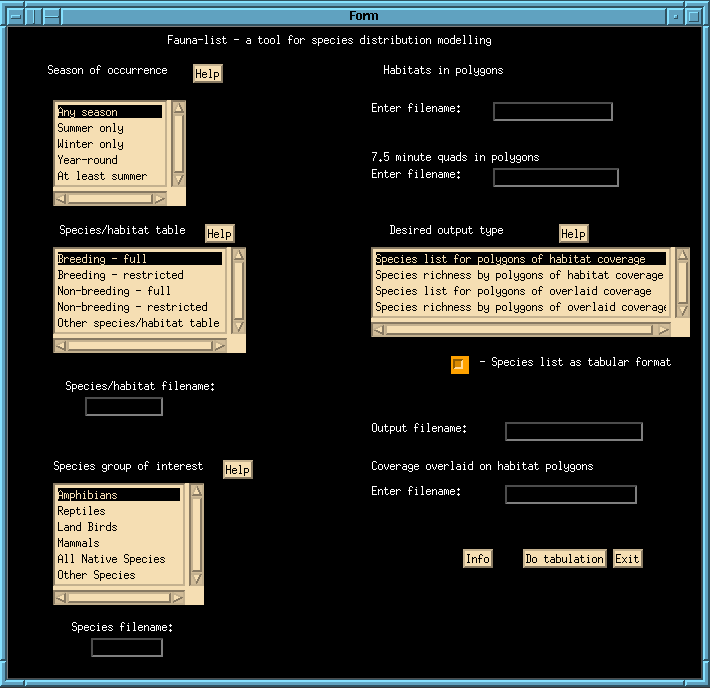
Figure 21. The graphical user interface for the FAUNA-LIST species modeling tool.
A SPATIAL MODELING AND DECISION SUPPORT SYSTEM FOR CONSERVATION OF BIOLOGICAL DIVERSITY
Wildlife Habitat Modeling
The California Wildlife Habitat Relationships system (WHR) is a database concerning the habitat requirements and distribution of the resident terrestrial vertebrates of the state. This database has been developed by an interagency group of wildlife biologists to provide a reference tool for wildlife management decisions. Though this database provides some geographic descriptors, it is fundamentally a non-spatial database. In many applications, it would be useful to link the database to a GIS, for instance to display the habitat suitable for a particular species. This section documents a prototype GIS interface to facilitate this linkage, namely a pair of programs (Fauna-List and Fauna-Map) for use in the Arc/Info system. In addition, this section describes possible improvements to this system which could be developed with the most current GIS software.
This section will describe Fauna-List and Fauna-Map, two programs that have been developed in the ARC/INFO environment to perform distribution mapping using WHR. These programs have a graphical user interface which is constructed using tools available in Arc/Info. These programs were designed to assist in coarse-scale distribution modeling, and thus are specialized for that purpose: they use a generalization of the WHR database that lacks habitat elements and structural information.
There are a number of database issues that arise in this distribution modeling. First comes the complexity of the database. The vegetation map may have several thousand polygons, each with a complex series of attributes. And each of these polygons will acquire in this modeling a list of potentially hundreds of species. Keeping track of this list poses management difficulties, especially since INFO, the database manager resident within the GIS, copes poorly with such complexity. Our strategy has been to develop a special format for storing these species lists, and to create a script to import these lists into the GIS. Finally, there is a need to develop a graphical interface to facilitate rapid and repeated modeling.
The two programs Fauna-List and Fauna-Map were developed to aid in this distribution modeling. Both programs run in a Unix environment where Arc/Info has been installed. The first program, Fauna-List, takes as input a list of WHR types in each polygon in the vegetation map as well as a list that relates each polygon to the coarse-scale range map and, after letting the user specify analysis options, outputs a list containing the species in each polygon. This species list is stored as an ASCII table external to the GIS. The second program, Fauna-Map, is run inside the ARCPLOT module of ARC/INFO to display the distribution of a selected species or, alternatively, to allow a user to query a polygon to list the species present. These programs are constructed using the Form menu capability in ARC/INFO which allows a programmer to construct simple graphical interfaces in ARC/INFO. In turn these graphical interfaces interact with the ASCII table by calling programs external to the GIS written in the scripting language Perl.
The interface for Fauna-List, shown in Figure 21, presents the user with many options to control in generating distribution models. Though this interface is made using Arc/Info tools, it is in fact run outside of the GIS in the Unix shell. In the interface, these options are presented through the use of choice lists and input windows. The input files are specified in the windows at upper right: these include the file containing the list of WHR types found in each polygon and the file for the list of the 7.5' quadrangle found in each polygon. Below this is a choice list giving the possible output options. These include both a species list and a species richness count for each polygon. Additionally, one can generate a species list or species richness count for polygons in any coverage that is overlaid on top of the habitat coverage, such as one giving different management units. Below this list is a window to enter the name of the output file. At left in this interface is a series of choice lists. The top of these lists allows lets the user to specify the season of occurrence which is a parameter that relates to the different summer and winter ranges of species. Below that there is a list of different species/habitat tables to choose from. This list of different tables allows a user to choose among a variety of ways the WHR database has been simplified. At bottom is a choice list allowing entry of the species group of interest in the modeling.

Figure 21. The graphical user interface for the FAUNA-LIST species modeling tool.
The output from Fauna-List is a formatted ASCII table giving the WHR codes for the species predicted in each polygon. But it is not possible to display the distributions of the species expressed in this table directly in the GIS, and there is a need for a specialized import routine. The program Fauna-Map is an interface to import and display the distribution information in this table. It runs from the ARCPLOT module in ARC/INFO, and like Fauna-List, is structured as an ARC/INFO form menu interface that calls a Perl script to process the ASCII table importing needed information into the GIS. The main screen for the Fauna-Map interface is illustrated in Figure 22. These programs are now available for other researchers in Gap Analysis to modify for their own datasets and uses.

Figure 22. Fauna-Map interface for generating the predicted distribution for a user-selected species.